
If you read the print media and/or watch television (not that I recommend either), you can be forgiven for thinking that the UK economy has entered into a recovery from the deep collapse of 2008-2009 and the tediously long stagnation that followed. Selling the idea that we are in the throes of recovery is not an easy task not withstanding the media blitz to that effect. If a recovery there is, it missed most of us.
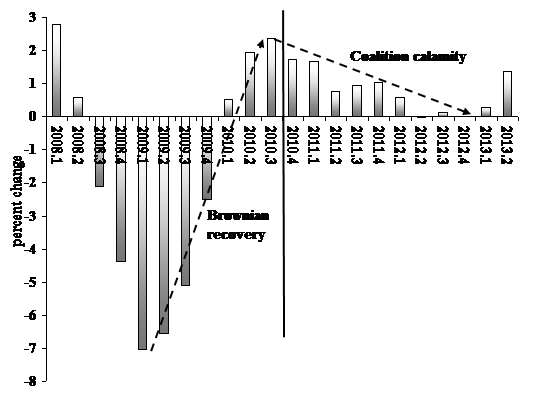
The story of the alleged current recovery can be encapsulated in a paraphrase of Winston Churchill’s famous speech in November 1942, “this [0.6% growth] is not the end, not even the beginning of the end, nor even the end of the beginning”. To be concrete, the media missed the recovery by four years. It began in the second quarter of 2009 and continued unabated until the Coalition under the steady hand of George Osborne killed it off in the fourth quarter of 2010 (see chart below).
Mr Osborne kills a recovery
Year-on-year percentage change in gross national product, 2008-2013
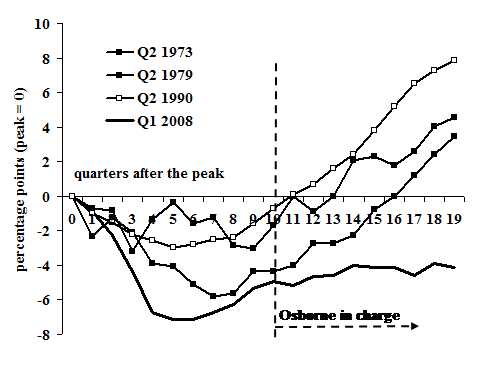
The 1.4% year on year growth for the most recent quarter may impress some. However, if sustained for all of 2013 it would represent a very weak recovery by any measure, including previous UK recoveries. To demonstrate the weakness I reproduce a diagram found in the Office of National Statistics, Economic Review (July 2013). My only change to the ONS diagram is to set the peak value at zero rather than 100. I do this so that every subsequent point on the diagram shows whether GDP is above or below the peak.
For example, the recession that began in the second quarter of 1990 (Q2 1990) began to sustain output above the previous peak in the 12th quarter after the peak. The 1973 recession regained growth after 14 quarters, and the 1979 recession after 17 quarters. What about the current recession? 19 quarters later (three months shy of 5 years), we remain four percentage points below the peak of the second part of 2008. To put the point succinctly, compared to other recessions, the economy is stagnant.
Part 1: Percentage point differences from peak GDP for the current and past recoveries from recession (pre-recession peak = 0)
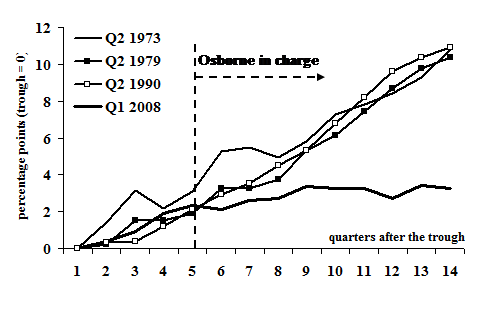
A Coalition supporter might say, “well, after such a deep recession, hardly surprising that we have not recovered to where we were in 2008”. The next diagram casts doubt on this defense of Coalition economic (mis)management. The diagram shows the same recessions, but as percentage point differences from the lowest point in each recession (“trough”). To cover 14 quarters for all four recoveries I extended the ONS numbers for the recessions of 1973 and 1979 using statistics from older ONS reports.
The story of economic management under the current Chancellor gets worse. By the fifth quarter after the trough of all four recessions, the UK economy had recovered two percentage points above the trough in three (1973, 1990 and 2008), and three percentage points in one (1979). For the current recession the fifth quarter coincides with the election that brought the Coalition to power. In other words, David Cameron’s predecessor Gordon Brown left him with an economy whose recovery was on schedule compared to the previous three.
Then the Prime Minster passed the task of economic management to an Oxford graduate in Modern History named George Osborne. From apace with previous recoveries, almost three years later Mr Osborne finds the British economy eight percentage points below each of those recoveries. And, a longer look at the numbers reveals that are living in the slowest UK recovery since 1945.
Part 2: Percentage point differences from trough GDP for the current and past recoveries from recession (pre-recession trough = 0)
Mr Osborne or one of his defenders might say, “our recovery may look weak, but it is strong compared to what is happening in other countries, especially those in Europe”. We find the refutation of this rather lame argument in the same ONS Economic Review, in a chart with the polemical title, “GDP levels in the G7 countries”. To keep simple the reproduction of the chart, I leave out Italy and Canada (neither of which seem Mr Osborne’s referent countries), which leaves us with five – France, Germany, Japan, USA and UK. Again I have recalibrated the ONS chart, so that the GDP level at the beginning of 2008 is zero, rather than 100.
The chart makes for embarrassing reading from a Coalition perspective. One country suffered a recession deeper than the UK (Japan), and one almost as deep (Germany). Japanese GDP is now a percentage point above the beginning of 2008, and Germany two percentage points above. The United States economy has recovered to four percentage points above the beginning of 2008.
Then, we have France and the UK. For France the story could be titled, “creeping along the ceiling”, because for over two years French GDP has been at one percentage point or less than the peak back in 2008. That rather pathetic performance looks good compared to the UK, stuck in the range of -3 to -5 percent of where it was at the beginning of 2008.
Part 3: UK stagnates while most of the others grow, percentage point differences in the level of GDP compared to the first quarter of 2008 (France, Germany, Japan, USA and UK)
Note: Second quarter of 2013 preliminary estimates for all but the UK.
Mr Osborne calls this miserable performance “recovery”. The media dutifully repeat the word. You need be neither an opponent of the government nor an economist to recognize that calling recent economic performance recovery is nonsense. You need only read what the government itself reports about the economy.
If the temperature of a flu victim dropped from 103 to 102.8 would you call it recovery? Or would you say, “lucky it’s not worse”?
John Weeks new book, Economics of the 1%: How mainstream economics serves the rich, obscures reality and distorts policy (Anthem Press) will come out in October 2013 and can be pre-ordered from Amazon of the publisher.
John Weeks, Professor Emeritus, University of London, http://jweeks.org
The Part 3 graph is a duplicate of Part 2. I’m keen to see the comparison of UK to France.