
In a fair two-party voting system, whoever gets the most votes wins, even if it’s by one vote, and a result can be as close as 51% to 49%. But under First Past the Post (FPTP), it isn’t quite as simple as that. If we change the winning criteria from 50/50 to, say, 45/55 in favour of A, so when A gets 46% and B 54% – A wins and B voters (who are in the in the majority) lose and should be very indignant. Unfortunately, this is what we suffer under FPTP when several parties are on offer.
During our elections, constituency votes are counted, parties are ranked in vote order and the party with the highest number of votes wins. Effectively the second party’s vote share establishes the pass criteria or level – anything that surpasses it wins. This criteria will be less than 50% of total votes, but perhaps 45% or lower depending on the spread of votes over parties in third, fourth place etc. Without these parties it would be a simple 50/50 competition.
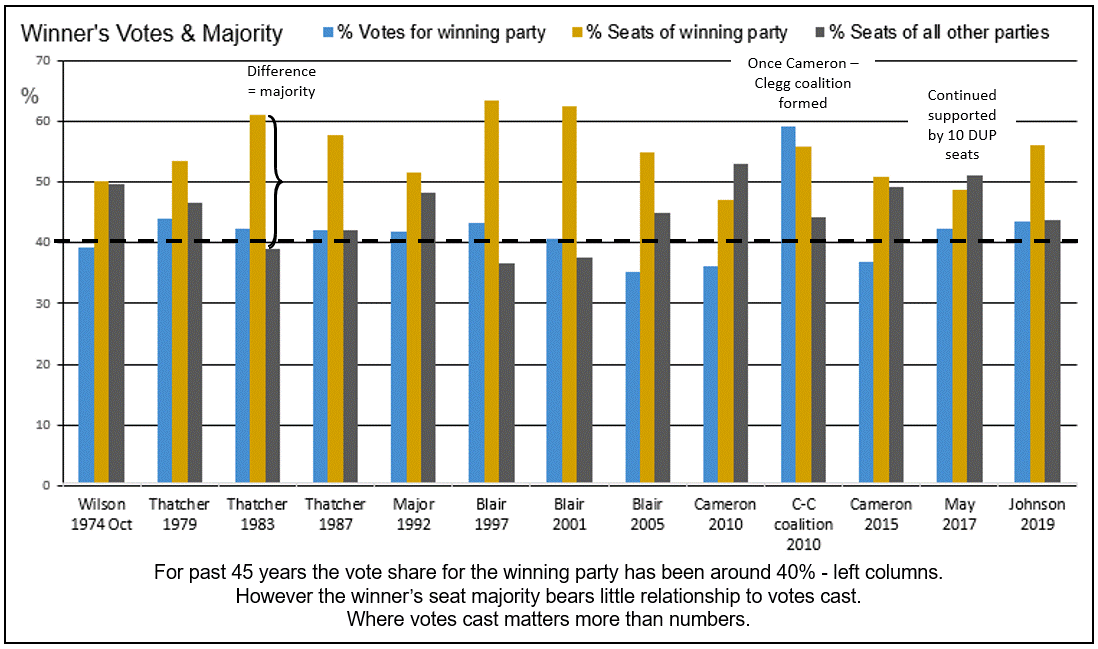
45 years of election results
The chart below records the results of every election since 1974. It shows the vote and seat share of the major party, and the seat share of all the remaining parties. The difference between the two seat columns represents the major party’s majority in percentage terms.
Some “unexpected” results:
- The percentage of votes cast for Thatcher (or rather her Conservative candidates) in 1987 and May in 2017 was the same at 42%. However, Thatcher gained a 102 seat majority, while May a 16 seat minority, requiring the DUP’s 10 seat support.
- Blair’s 1997 landslide victory after Major in 1992 is reported as a 10.2% swing (3rd ever highest) from Conservative to Labour, it also gave Blair a record 177 seat majority. But it was just a 1.3% rise in voter share – Blair votes were somehow much more influential.
- The only government of the last 45 years to represent substantially more than 40% of votes was the coalition of 2010 with 59% of voter support, but this still only gave a 76 seat majority. Otherwise for near half a century, governments of various majorities, which have little relevance to vote share, have been elected on just 35% to 44% of votes.
Intuitively you would think Thatcher and May had different vote shares, or Blair’s landslide victory was due to Labour massively increasing its vote share, but instead the chart implies that if you take the same general quantity of votes (35% to 44%) and re-shuffle them, hey presto: a totally different result.
But as in any competition the result is as much about the performance of the losers as that of the winner. Unfortunately, FPTP skews the effect of the losers’ performance, plus its winner-takes-all nature means it can win everything just by getting one more vote than the second place party. More than one vote is nice as it gives more moral authority, or even creates a safe seat, but each MP in the voting lobbies is one vote, whatever their majority, moral authority or mandate, and regardless of constituency size, from Isle of Wight of 113,021 to Na h-Eileanan an Iar in the Outer Hebrides of 21,106.
Categorisation of votes
For a a party to win a seat, it needs one vote more than the second place party – but more than one is nice, as above. The minimum level of votes to win each seat (MtoW) can be extracted from results and aggregated to give a total for the party and then expressed as a percentage of total votes.
The following chart shows the original vote share but the votes of each winning party are now in broken down into four categories: minimum votes to win the seats (MtoW); the additional votes gained above the MtoW threshold (or, the majority); votes making up second place losses; and votes lost to third or greater place. The chart is now in order of seats gained, and the coalition resulting from 2010 is omitted. The MtoW is the important category as it is key to winning seats, the majority is nice to have and the other two categories are effectively wasted votes – they just affect the results of other parties.
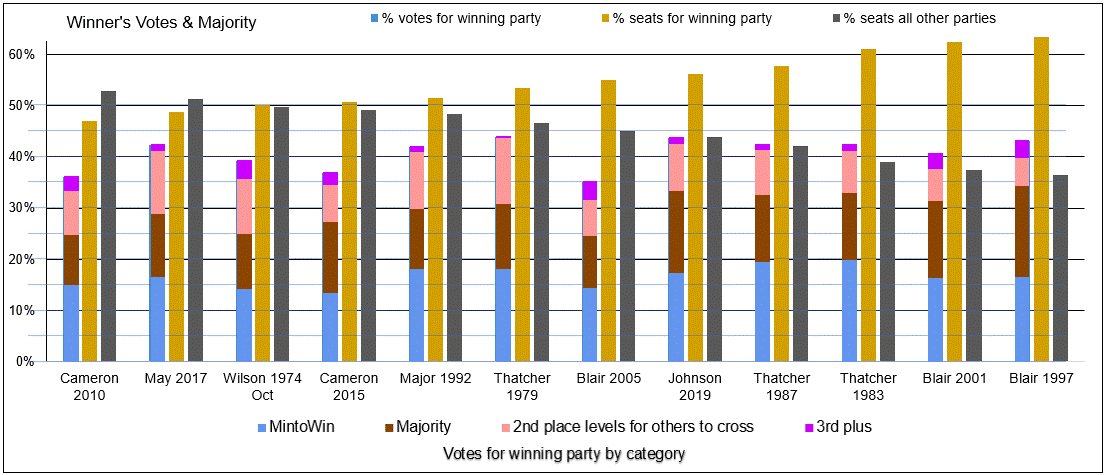
It follows that a low MtoW means seats are gained more easily, as the threshold the winning party must cross is lower. However, a lower MtoW doesn’t always correlate with larger seat numbers – Blair’s successful period has low levels, but Thatcher’s 1983 victory bucks the trend. If seats gained is considered in relation to MtoW, instead of total vote share, it only goes to exaggerate the differences. All governments have been elected on 35% to 44% total vote share, but with MtoW it’s a smaller range of 13.3% 19.7%.
Unfortunately vote categorisation and MtoW doesn’t explain the relationship between votes and seats, but it reveals some additional influencing factors, for example: Blair’s 1997 record breaking success of 418 seats (63.4% with just 1.3% extra voter share) was probably due to a lucky combination of factors:
- Realistic constituency ambition; Labour only stood in 97% of them.
- Good vote share of 43.2%
- Some fragmentation of National opposition where 4.2% of National Votes went to 37 parties who didn’t gain any seats, giving a highish national fragmentation of 67%, explained in full article.
- Low-ish MtoW of 16.5%
- Distribution of MtoW skewed to low end, giving a very high number of easy gains.
So was this a massive swing from Conservative to Labour giving the highest majority since 1935? The votes were high, albeit lower than Thatcher’s in 1987 and Johnson’s in 2019, but Blair’s MtoW was lower than theirs. Or was it a slight move to the left and a gift from the vagaries of FPTP?
Pretence and democratic subterfuge
Parliamentary majorities are described as the major party’s seats minus all opposition seats (i.e. they must have more than 50% of the seats to win). However, a constituency majority is the winning candidate minus the second one, and all other place votes are ignored (i.e. any %). If this definition was applied to the 2019 parliament, Johnson’s majority would be 163 rather than 80, as all seats but Labour’s would be ignored.
In parliament the pretence of a two-party system is plain to see, but at constituency level the inappropriateness of FPTP for multi-party elections becomes too obvious, as it demands we pretend that only two parties exist.
Potatoes come in a variety of shapes and sizes so it’s appropriate to buy them by weight. Shops cannot sell a lucky-dip bag of 20 potatoes for 80p where some get a bargain while others get ripped off. So why do we elect a variety of parties of different shapes and sizes by an inappropriate method of lucky-dip FPTP?
We need to understand of the harm of FPTP, to really take back control and instigate an appropriate method to elect governments that represent all our wishes; and so be able to cast a truly effective vote, without party pacts or tactical voting.